Train doors are not a peripheral concern. They are the first point of contact between the passenger and the vehicle — and any failure has an immediate impact on operations. A train with a door that won’t close properly is stranded at the platform. On a high-speed network, every minute of standstill cascades across the entire timetable.
We worked with a national rail operator to implement predictive monitoring of its door systems across a fleet of next-generation high-speed trains. Here is what that experience reveals about the real-world capabilities of predictive maintenance applied to rolling stock.
The Challenge: Massive Data, Zero Fault History
The starting point was both promising and daunting. The operator had access to onboard data from the Door Control Units (DCUs) of its fleet, logging every opening and closing cycle at high resolution. Over just a few weeks, the dataset covered nearly 75,000 analyzed cycles — more than 10 million individual records in total.
Each cycle was described by over 129 variables: motor current, voltage, leaf travel speed, positions, pressures, timestamps. Each cycle contained between 305 and 389 measurement points. In terms of volume, data was not the problem.
What was almost entirely absent, however, was a usable fault history. The fleet was new, failures were rare — and when they did occur, the link between maintenance events and sensor readings was never captured in the systems. Training a conventional supervised model was out of the question. This is precisely the type of situation where an unsupervised approach — DiagFit’s Blind Mode — comes into its own.
From Raw Signals to Behavioral Profiles: The Clustering Approach
The first step was not to hunt for anomalies, but to understand the normal variability of the system. A train door does not behave identically on every cycle. Operating conditions shift continuously: outside temperature, train load, network electrical parameters, mechanical wear. Expecting a static definition of “normal” would be a mistake from the outset.
The analysis proceeded in three stages. First, independent clustering was applied to each physical variable. Motor current waveforms were grouped by similarity — independently of voltage and speed profiles. The same was done for every other signal. Each variable revealed its own families of behavior.
Next, a global aggregation combined the clustering scores from each variable to define overall System States. A cycle where current follows Profile 1, voltage follows Profile 1, and speed follows Profile 1 is assigned to State A. A cycle with a different combination falls into a different state. This multi-variable approach captures behavioral patterns that single-variable analysis would have missed entirely.
Finally, atypical cycles — those that did not correspond to any identified cluster — were isolated mathematically. Of the 75,000 cycles, 4 exhibited abnormal durations: over one minute, compared to the few seconds typical of normal operation. These outliers were removed from the healthy reference dataset, confirming the algorithm’s ability to separate signal from noise.
When Data Reveals What the Eye Cannot See
The most striking finding from this analysis phase was not the detection of obvious anomalies. It was the discovery of hidden structures in the data that no one had anticipated.
Temporal analysis revealed that the door system alternated between two distinct operating configurations, with clean transitions at specific dates. Current, voltage, and speed profiles changed simultaneously — pointing to a fleet-wide parameter adjustment or a shift in control mode. This discovery, invisible in the raw data stream, had a direct implication for the rest of the project: building a predictive model without accounting for these two configurations would have generated a flood of false alerts at every transition.
Beyond that, a striking mechanical regularity emerged within the cycle sequences. A specific cluster recurred at precise intervals of 2 minutes and 49 seconds, regardless of the active configuration. This periodicity corresponded to the system’s automatic test sequences — a perfectly normal behavior, but one that only algorithmic analysis could isolate from the continuous flow of data.
The lesson is clear: before deploying an anomaly detection model, you first need to understand normality in all its complexity. Industrial data is never simple, and methodological shortcuts are paid for in false alerts.
From Characterization to Prediction: Building a Monitoring Model
This first characterization phase laid the foundations for the predictive model. Nominal operating modes had been identified, normal variability had been quantified, and atypical cycles had been isolated. The ground truth was established.
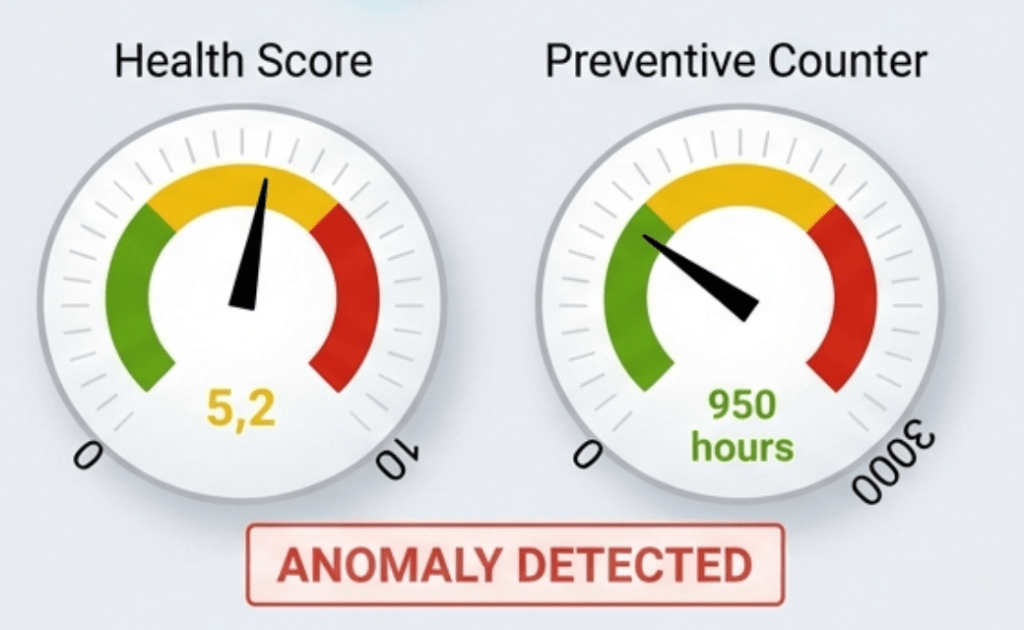
The next step was to feed DiagFit‘s Blind Mode detection engine with this reference data. The model learns the Green Zone — the behavioral space of healthy operation — and then computes a Health Indicator score for each new cycle, from each door, on each vehicle.
On other fleets where the same approach has been deployed at greater scale, the operational results are compelling. The scoring system distinguishes, across a fleet of several hundred trains, which assets are drifting from those operating normally. The identification is not generic: it drills down to the specific train, vehicle, and door controller. And the root cause analysis automatically pinpoints the variable responsible for the score degradation — motor overcurrent, voltage drift, speed anomaly.

Operational Impact: Putting an End to Blind Interventions
For maintenance teams, the change is tangible across three dimensions.
Diagnostic precision transforms the nature of interventions. Instead of receiving a generic alert that triggers a full door system inspection, the technician knows exactly which component to examine and what type of fault to look for. Field diagnosis time is reduced, and No Fault Found interventions — where the technician leaves without identifying the root cause — are effectively eliminated.
The granularity of the scoring enables intelligent prioritization of maintenance work. Not all scores above the critical threshold are equally urgent. An asset whose score has just crossed the threshold may be able to wait for the next planned maintenance window. One whose score has been accelerating over several days requires immediate action. This level of prioritization — impossible with a simple binary alert — optimizes the allocation of maintenance resources.
Finally, fleet-wide health visibility enables the shift from a reactive posture (intervening when the driver reports a problem) to a proactive one (scheduling the intervention before the issue becomes visible in operations). For maintenance management teams, this represents a fundamental change in how they work — and how they plan.


